Autocal Software
You want graphs? We got 69 more of these!
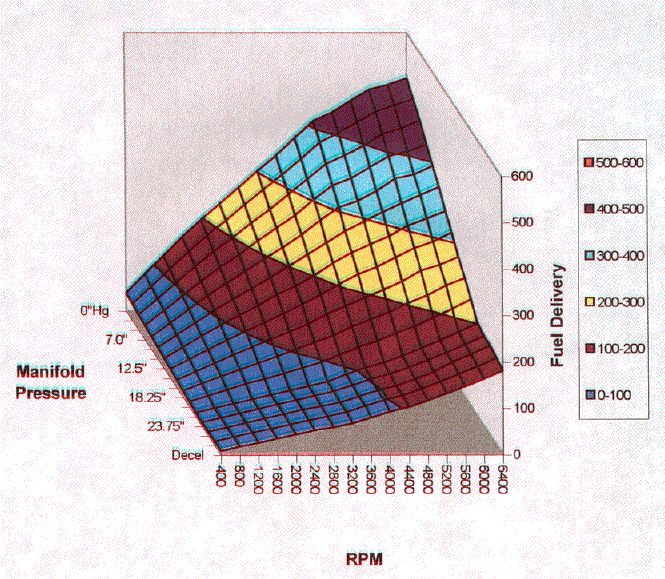
Everyone loves 3D graphs as they have a distinctive "wow" factor. The graph plots rpm, load, and fuel delivery. It is useful to visualize changes in volumetric efficiency due to camshaft, exhaust system changes etc. Autocal generated these and many other graphical displays to aide you in your tuning and prediction/analysis of RSR Fuel Injection Systems ecu calibrations. All graphs automatically scale to the vehicle's rpm range up to 16000 rpm.
3D Graphs are essentially useless. About te only thing they are good for is to see so really gross error. People do love them however.
![]()
![]()
![]()
![]()
![]()
![]()
![]()
![]()
![]()
![]()
![]()
![]()